
Website statistics for car dealers: see what happens on your site
NEWMost dealers pay for a website every month without ever getting to see what happens on it.
Ask a dealer how the website is doing and the answer is usually a feeling. It seems to work. The phone rings.
That is rarely the dealer's fault. The site was built by an agency or a supplier, and the numbers stay there. Sometimes there is a login nobody ever received, sometimes a report turns up when the contract is due for renewal. And if a Google Analytics install is running underneath, it was built for web analysts, not for someone deciding which car to buy in next week.
Visits are not the same thing as something to act on
The number of visits says almost nothing on its own. What you need to know is which cars people open, what they search for in the stock list, which cars get enquiries and which get none at all. That is where a website either brings in business or stands still.
The information is in the traffic the whole time. It has just rarely reached the person who owns the dealership.
What the visitor statistics show
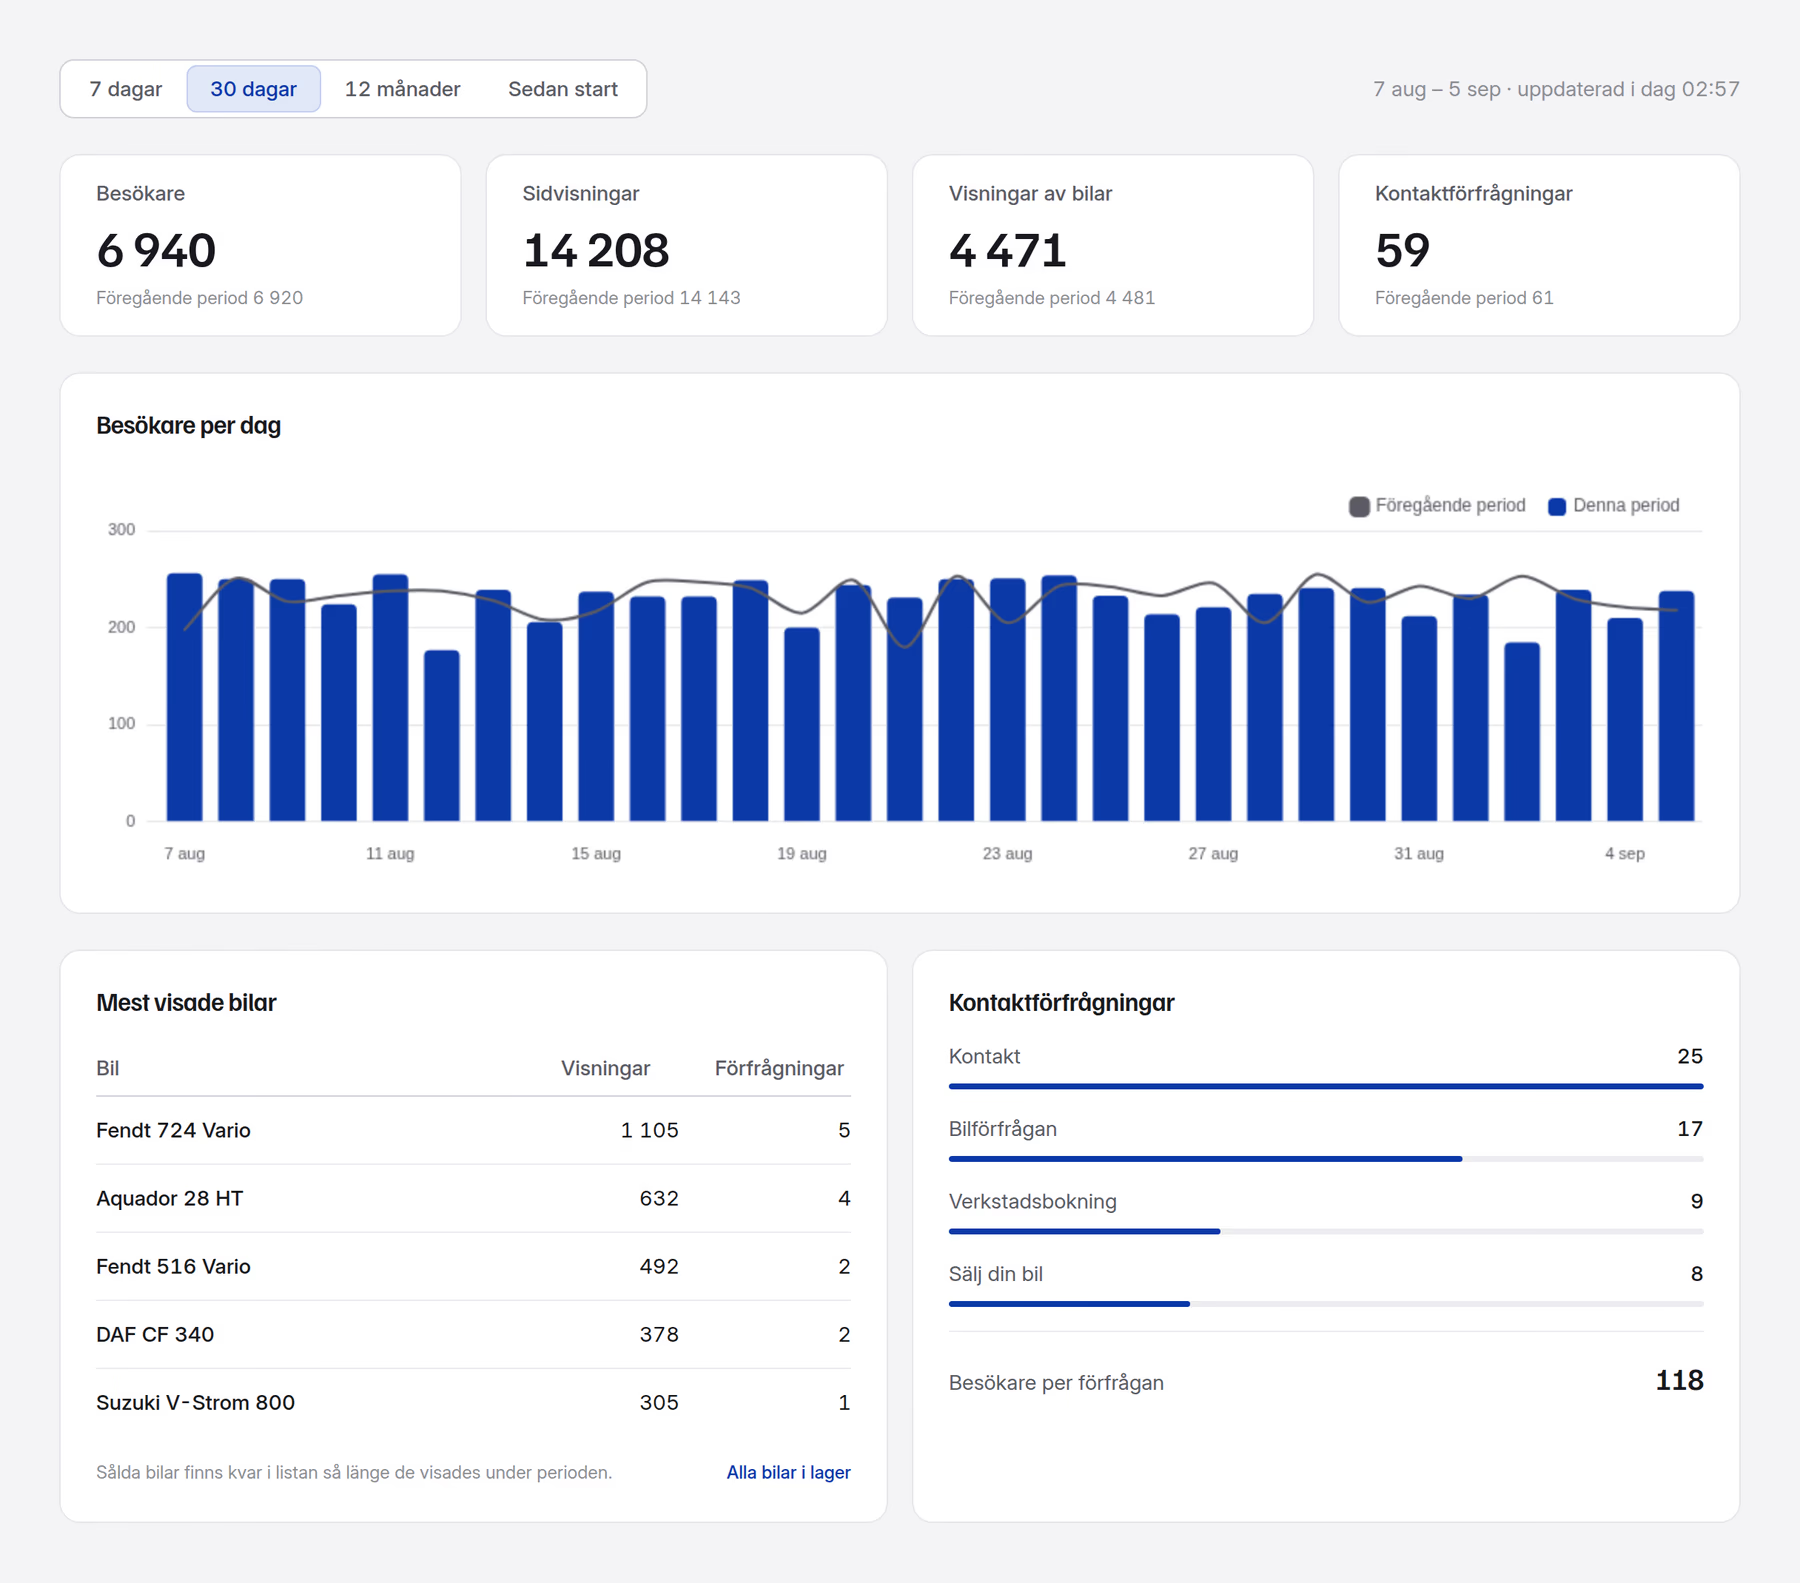
The statistics sit under Website in the portal. You pick a period — seven days, thirty days, twelve months or since the start — and everything is set against the previous period of the same length, so a real rise can be told apart from the ordinary rhythm of a week.
Four figures sit at the top:
- Visitors
- Page views
- Car views
- Contact requests
Below them the visitors are plotted day by day with the previous period drawn over the top. The page also shows the split between mobile and desktop, which decides where the site is worth reviewing first.
The most-viewed cars, and the ones nobody asks about
The top list shows views and enquiries per car. A car with many views and no questions usually says something about the price or the photos. A car that is barely seen at all needs better photos, a different placement or ad money.
In the full stock list every car is listed with price, days in stock, views per day and enquiries. Cars that have been out for at least a week and are seen far less than the average are flagged, as are cars that are seen a lot and still have not had a single enquiry.
How visitors found you
Traffic is split across direct, Google, Meta ads, and Facebook and Instagram. That makes it possible to see what the advertising actually does on the website, rather than judging it on reach inside the ad tool.
The words they search for
Searches in the stock list are the most underrated number on the page. Every search is someone spelling out what they want. If twelve people search for a model you do not have in stock, that is a buying decision waiting to be made.
Requests are counted by type
Contact requests are split into contact, car enquiry, workshop booking and sell your car. The page also works out how many visitors it takes to produce one request, and that figure is the simplest measure of whether the site is doing its job.
How the numbers are kept current
Visitor figures are compiled once every twenty-four hours and kept day by day for thirteen months, then by month. Contact requests are counted the moment they arrive. The statistics are built on the website's own traffic, so there is no tracking code to install and no external account to connect.
Included with the website
The statistics cost nothing extra. If you already have the website with us, they are there under Website in the portal. Visitors are compiled every night, so the first figures appear the day after the site goes live.
The point is not more numbers. The point is the few that decide which car to buy in, which one to reprice and where the ad money does the most good.